Kafka in the Cloud: Why it’s 10x better with Confluent | Find out more
Ranking Websites in Real-time with Apache Kafka’s Streams API
This article is by Hunter Kelly, Technical Architect at Zalando. Hunter enjoys using technology, and in particular machine learning, to solve difficult problems. He’s a graduate of the University of California at Berkeley. Before joining Zalando in 2015, he spent years in the trenches working at companies such as Pixar and Google.
The Fashion Web
Zalando, Europe’s largest online fashion retailer, cares deeply about fashion. Our mission statement is to “Reimagine fashion for the good of all.” To reimagine something, first you need to understand it. The Dublin Fashion Insight Centre was created to understand the “Fashion Web”—what is happening in the fashion world beyond the borders of what’s happening within Zalando’s stores.
We continually gather data from fashion-related sites. We bootstrapped this process with a list of relevant sites from our fashion experts, but as we scale our coverage, and add support for multiple languages (spoken, not programming!), we need to know what are the next “best” sites.
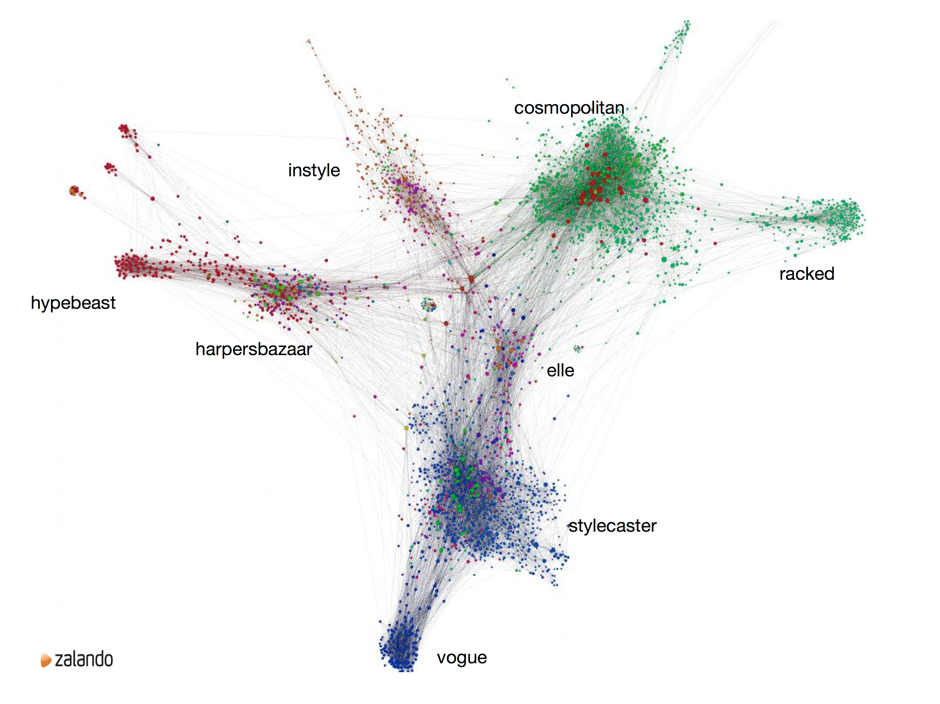
Conceptual view of some top sites of the Fashion Web
Rather than relying on human knowledge and intuition, we needed an automated, data-driven methodology to do this. We settled on a modified version of Jon Kleinberg’s HITS algorithm. HITS (Hyperlink Induced Topic Search) is also sometimes known as Hubs and Authorities, which are the main outputs of the algorithm. We use a modified version of the algorithm, where we flatten to the domain level (e.g., Vogue.com) rather than on the original per-document level (e.g, http://Vogue.com/news).
HITS in a Nutshell
The core concept in HITS is that of Hubs and Authorities. Basically, a Hub is an entity that points to lots of other “good” entities. An Authority is the complement; an entity pointed to by lots of other “good” entities. The entities here, for our purposes, are web sites represented by their domains such as Vogue.com or ELLE.com. Domains have both Hub and Authority scores, and they are separate (this turns out to be important, which we’ll explain later).
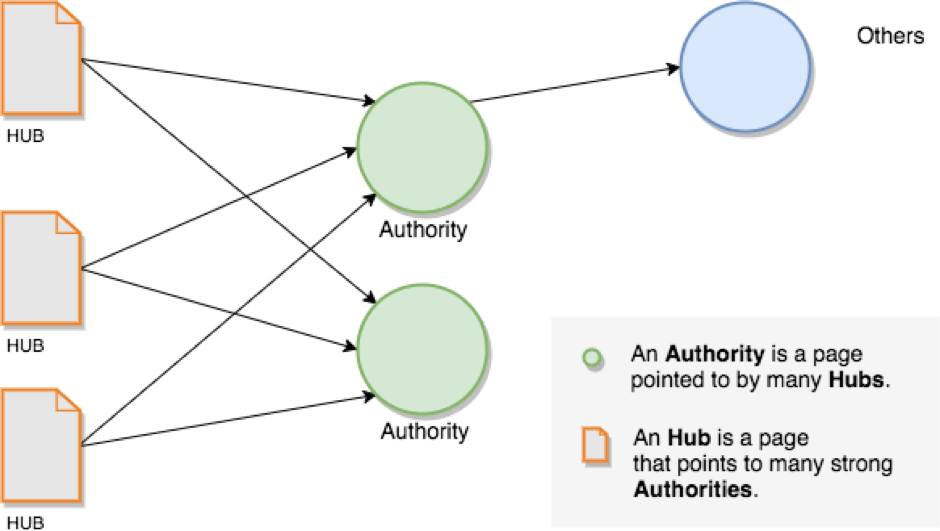
These Hub and Authority scores are computed using an adjacency matrix. For every domain, we mark the other domains that it has links to. This is a directed graph, with the direction being who links to whom.
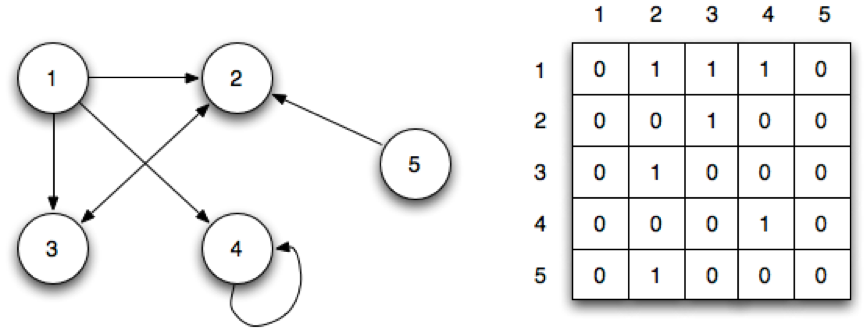
(Image courtesy of http://faculty.ycp.edu/~dbabcock/PastCourses/cs360/lectures/lecture15.html)
Once you have the adjacency matrix, you perform some straightforward matrix calculations to calculate a vector of Hub scores and a vector of Authority scores as follows:
- Sum across the columns and normalize, this becomes your Hub vector
- Multiply the Hub vector element-wise across the adjacency matrix
- Sum down the rows and normalize, this becomes your Authority vector
- Multiply the Authority vector element-wise down the the adjacency matrix
- Repeat
An important thing to note is that the algorithm is iterative: you perform the steps above until eventually you reach convergence—that is, the vectors stop changing—and you’re done. For our purposes, we just pick a set number of iterations, execute them, and then accept the results from that point. We’re mostly interested in the top entries, and those tend to stabilize pretty quickly.
So why not just use the raw counts from the adjacency matrix? The beauty of the HITS algorithm is that Hubs and Authorities are mutually supporting—the better the sites that something points at, the better a Hub it is; similarly, the better the sites that point to something, the better an Authority it is. That is why the iteration is necessary: it bubbles the good stuff up to the top.
(Technically, you don’t have to iterate. There’s some fancy matrix math you can do instead with calculating the eigenvectors. In practice, we found that when working with large, sparse matrices, the results didn’t turn out the way we expected, so we stuck with the iterative, straightforward method.)
Common Questions
What about non-fashion domains? Don’t they clog things up?
Yes, in fact, on the first run of the algorithm, sites like Facebook, Twitter, Instagram, et. al. were right up at the top of the list. Our Fashion Librarians then curated that list to get a nice list of fashion-relevant sites to work with.
Why not PageRank?
PageRank, when you’re Google and have nearly complete information about the web, is great. We are not Google. We only have outgoing link data on the domains that are already in our working list. We need an algorithm that is robust in the face of partial information.
This is where the power of the separate Hub and Authority scores comes in. Given the information for our seeds, they become our list of Hubs. We can then calculate the Authorities, filter out our seeds, and have a ranked list of stuff we don’t have. Voilà! Problem solved, even in the face of partial knowledge.
But wait, you said Kafka Streams?
Kafka was already part of our solution, so it made sense to try to leverage that infrastructure and our experience using it. Here’s some of the thinking behind why we chose to go with Apache Kafka’s® Streams API to perform such real-time ranking of domains as described above:
- It has all the primitives necessary for MapReduce-style computation: the “Map” step can be done with groupBy & groupByKey, the “Reduce” step can be done with reduce & aggregate.
- Streaming allows us to have real-time, up-to-date data.
- The focus stays on the data. We’re not thinking about distributed computing machinery.
- It fits in naturally with the functional style of the rest of our application.
You may wonder at this point, “Why not use MapReduce? And why not use tools like Apache Hadoop or Apache Spark that provide implementations of MapReduce?” Given that MapReduce was invented originally to solve this type of ranking problem, why not use it for the very similar type computation we have here? There are a few reasons we didn’t go with it:
- We’re a small team, with no previous Hadoop experience, which rules Hadoop out.
- While we do run Spark jobs occasionally in batch mode, it is a high infrastructure cost to run full-time if you’re not using it for anything else.
- Initial experience with Spark Streaming, snapshotting, and recovery didn’t go smoothly.
How We Do It
For the rest of this article we are going to assume at least a basic familiarity with the Kafka Streams API and its two core abstractions, KStream and KTable. If not, there are plenty of tutorials, blog posts and examples available.
Overview
The real-time ranking is performed by a set of Scala components (groups of related functionality) that use the Kafka Streams API. We deploy them via containers in AWS, where they interact with our Kafka clusters. The Kafka Streams API allows us to run each component, or group of components, in a distributed fashion across multiple containers depending on our scalability needs.
At a conceptual level, there are three main components of the application. The first two, the Domain Link Extractor and the Domain Reducer, are deployed together in a single JVM. The third component, the HITS Calculator and its associated API front end, is deployed as a separate JVM. In the diagram below, the curved bounding boxes represent deployment units; the rectangles represent the components.
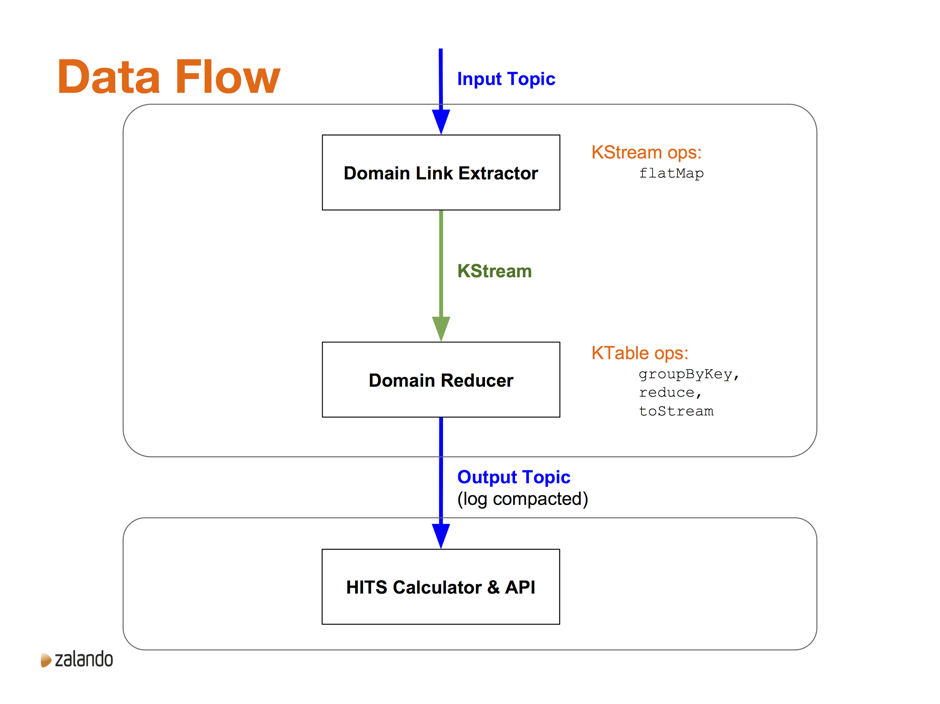
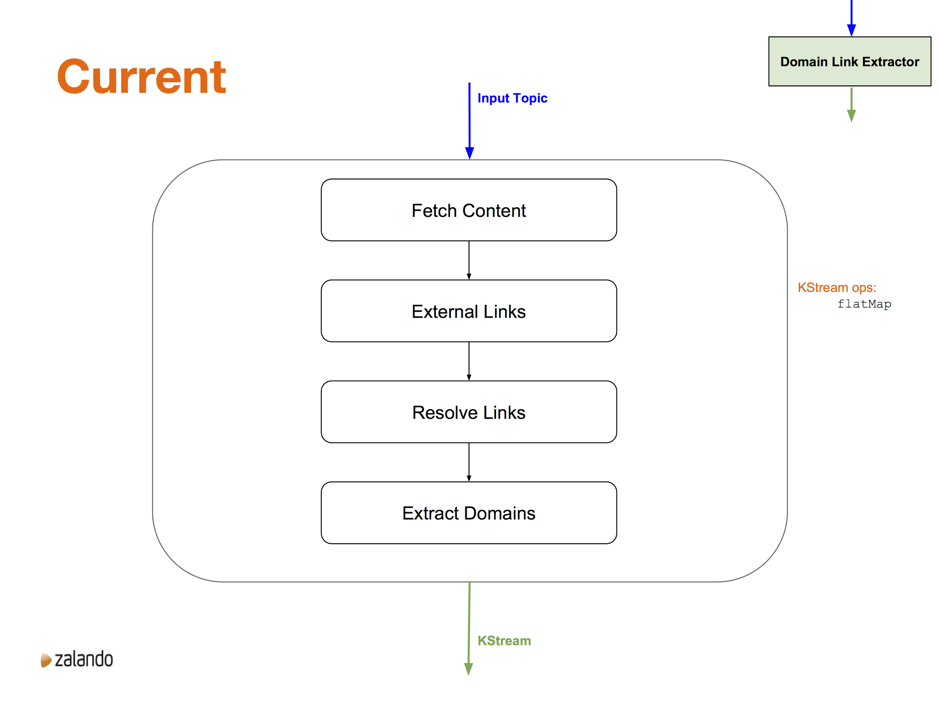
Data, in the form of s3 URLs to stored web documents, comes into the system on an input topic. The Domain Link Extractor loads the document, extracts the links, and outputs a mapping from domain to associated domains, for that document. We’ll drill into this a little bit more below. At a high level, we use the flatMap KStream operation. We use flatMap rather than map to simplify the error handling—we’re not overly concerned with errors, so for each document we either emit one new stream element on success, or zero if there is an error. Using flatMap makes that straightforward.
These mappings then go to the Domain Reducer, where we use groupByKey and reduce to create a KTable. The key is the domain, and the value in the table is the union of all the domains that the key domain has linked to, across all the documents in that domain. From the KTable, we use toStream to convert back to a KStream and from there to an output topic, which is log-compacted.
The final piece of the puzzle is the HITS Calculator. It reads in the updates to domains, keeps the mappings in a local cache, uses these mappings to create the adjacency matrix, then perform the actual HITS calculation using the process described above. The ranked Hubs and Authorities are then made available via a REST API.
The flexibility of Kafka’s Streams API
Let’s dive into the Domain Link Extractor for a second, not to focus on the implementation, but as a means of exploring the flexibility that Kafka Streams gives.
The current implementation of the Domain Link Extractor component is a function that calls four more-focused functions, tying everything together with a Scala for comprehension. This all happens in a KStream flatMap call. Interestingly enough, the monadic style of the for comprehension fits in very naturally with the flatMap KStream call.
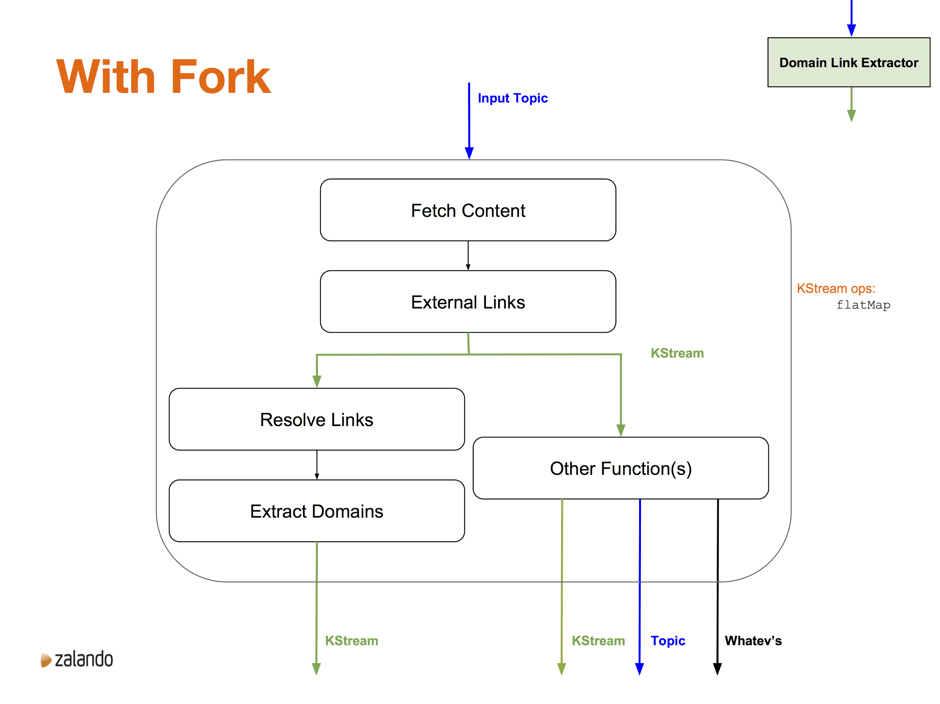
One of the nice things about working with Kafka Streams is the flexibility that it gives us. For example, if we wanted to add information to the extracted external links, it is very straightforward to capture the intermediate output and further process that data, without interfering with the existing calculation (shown below).
In Summary
For us, Apache Kafka is useful for much more than just collecting and sharing data in real-time—we use it to solve important problems in our business domain by building applications on top. Specifically, Kafka’s Streams API enables us to build real-time Scala applications that are easy to implement, elastically scalable, and that fit well into our existing, AWS-based deployment setup.
The programming style fits in very naturally with our already existing functional approach, allowing us to quickly and easily tackle problems with a natural decomposition of the problem into flexible and scalable microservices.
Given that much of what we’re doing is manipulating and transforming data, we get to stay close to the data. Kafka Streams doesn’t force us to work at too abstract a level or distract us with unnecessary infrastructure concerns.
It’s for these reasons we use Apache Kafka’s Streams API in the Dublin Fashion Insight Centre as one of our go-to tools in building up our understanding of the Fashion Web.
About Apache Kafka’s Streams API
If you have enjoyed this article, you might want to continue with the following resources to learn more about Apache Kafka’s Streams API:
- Get started with the Kafka Streams API to build your own real-time applications and microservices.
- Walk through our Confluent tutorial for the Kafka Streams API with Docker and play with our Confluent demo applications.
Did you like this blog post? Share it now
Subscribe to the Confluent blog
Chopped: AI Edition - Building a Meal Planner
Dinnertime with picky toddlers is chaos, so I built an AI-powered meal planner using event-driven multi-agent systems. With Kafka, Flink, and LangChain, agents handle meal planning, syncing preferences, and optimizing grocery lists. This architecture isn’t just for food, it can tackle any workflow.
Predictive Analytics: How Generative AI and Data Streaming Work Together to Forecast the Future
Discover how predictive analytics, powered by generative AI and data streaming, transforms business decisions with real-time insights, accurate forecasts, and innovation.

